






Fitness club reporting software: what ABC Insights can do for your club group
Running a multi-location club group without one consistent view of performance means every location tells its own story. Each studio reports its numbers its own way, HQ gets them late, and decisions get made on partial data.
This guide covers ABC Insights and ABC’s reporting platform for ABC Ignite, which is replacing ABC Financial’s Club Reporting System (CRS): what you can report on, how multi-location comparison works, and how reporting ties into collections and member retention.
From static reports to always-on club performance dashboards
Many club groups still rely on scheduled exports. A report arrives, someone opens it, and the numbers describe last week. By the time a failed payment or a slow class shows up in the file, the window to act has often closed.
How dashboards replace the export cycle
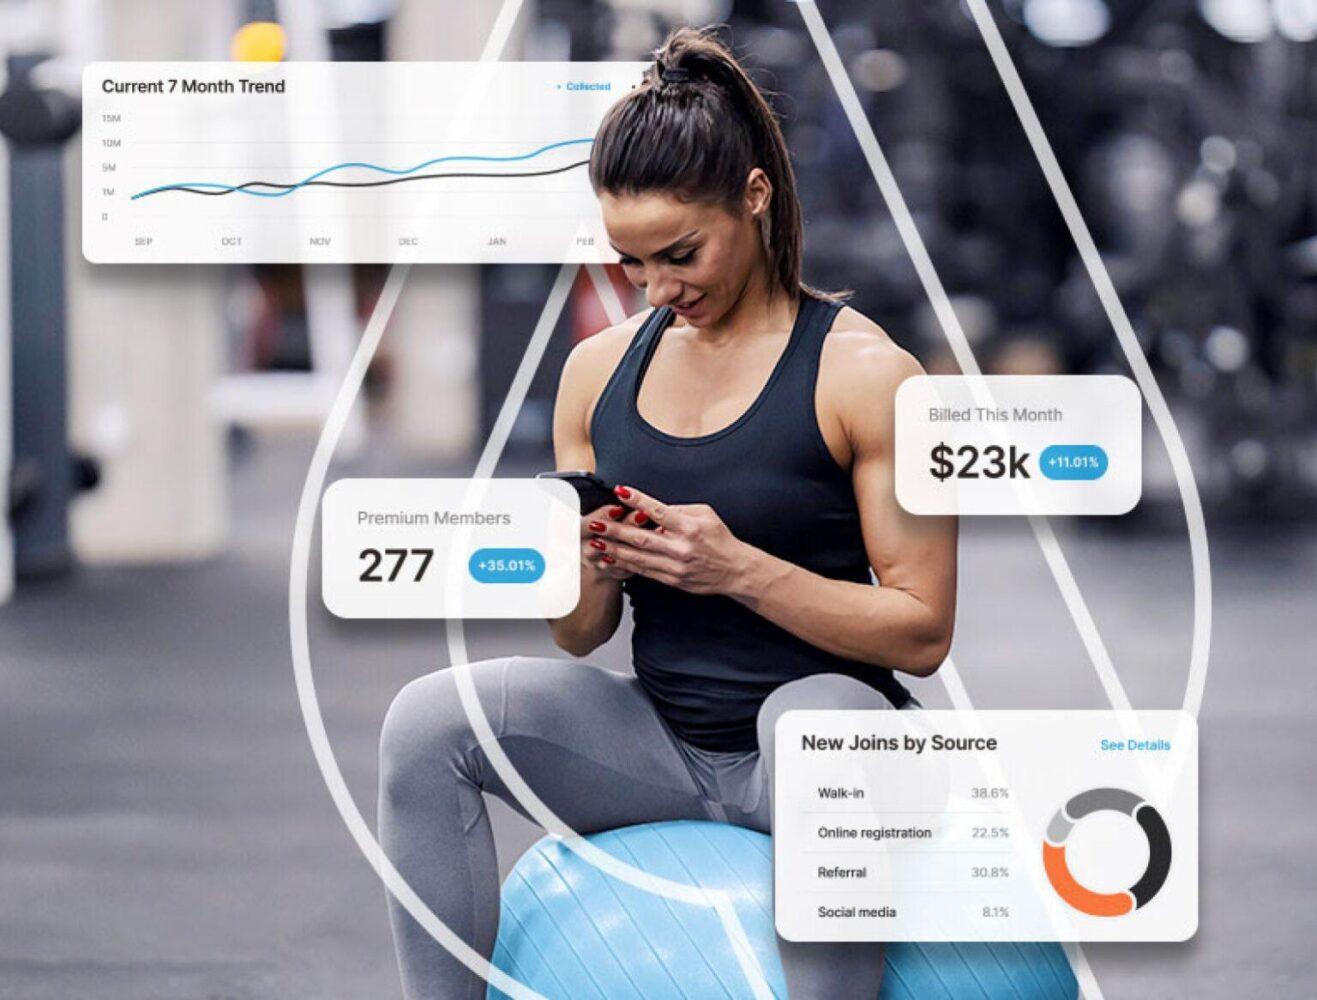
ABC Insights replaces that cycle with prebuilt, visual dashboards that track key performance indicators. Data refreshes throughout the day and is always updated through yesterday, so teams act on last night’s numbers, not last week’s. When a team needs more detail, the same data can be set up as tabular reports and exported to spreadsheets or business intelligence tools.
This matters most for daily decisions. A studio manager deciding whether to add a class time, a regional leader deciding where to send a coach, and an operations director deciding which location needs help this week all need the same current picture.
📝 Go deeper: ABC Ignite Insights
📝 Read more: ABC Insights for Glofox
The metrics multi-location operators need to track
Good reporting starts with a short list of numbers that every location agrees on. ABC Insights includes a KPI catalog and a pre-built report catalog, so teams start from shared definitions instead of rebuilding spreadsheets.
Revenue and collections trends
Insights tracks revenue and cash flow, including how late payments and cancelled memberships affect cash. The goal is to see collections slipping at one location before it shows up in the quarter’s total. The Revenue Analysis dashboard totals revenue across billing and point of sale, compares it with the prior month and prior year, and shows how much each club contributes and which membership type brings in the most.
Member attrition and at-risk members
ABC Insights includes Attrition Analysis and New Joins Analysis dashboards, so cancellations can be read alongside new memberships, and a Member Analysis dashboard that shows who your members are and how they engage. ABC Glofox also has a dedicated Members at Risk report.
Check-ins and utilization
Club utilization is part of the KPI catalog, and footfall traffic is a named metric. The Class Utilization dashboard adds nine views of class performance by location, trainer, program, day and time, with 13-month trending, and check-in reporting breaks check-ins down by hour and by membership type.
Chargebacks and payment disputes
ABC Insights includes a chargeback summary report and a chargeback detail report. Chargebacks also appear in most revenue reports once they are processed.
📝 Go deeper: IGNITE Insights – Check-In Analysis and Class Utilization Reports
📝 Check out: Fitness Analytics 101: How to Utilize Data for Maximum Impact
Standardizing KPIs across every location
A club group can compare locations fairly only when every location measures the same thing the same way. If one studio counts a trial as a member and another does not, the comparison misleads. Shared KPI definitions come first, and the reporting platform should hold them steady.
Why every location needs the same KPI definitions
Franchise and multi-location operators also need room for local managers to run their clubs. HQ still needs one standardized view across all of them. The aim is one set of definitions that leadership sees everywhere, while each local team works from the same numbers.
Comparing locations side by side with the multi-club report
ABC Insights includes a multi-club report in its pre-built catalog, and sales performance can be reported across locations. Side-by-side comparison is what turns that data into a decision. A location with strong sales and weak utilization needs a different fix than one with the reverse, and placing the same KPIs next to each other makes that visible.
📝 Read More: How to Manage Multiple Gym Locations: The Complete Operational Guide for Fitness Chains
Turning reporting into action: retention, collections, and growth decisions
A report matters only when it leads to a decision someone makes this week. The goal is to move from seeing a problem to acting on it, whether that means reaching out to a member, chasing a failed payment, or moving coaches and budget to a location that needs them.
Retention starts with a flag. When a member’s activity drops, the team should hear about it before the membership lapses. On ABC Glofox, a dedicated Members at Risk report covers this. On ABC Ignite, the Check-In Alerts dashboard shows check-ins by member status, and the New Joins Analysis, Past Due Analysis and First Payment Default reports point to the groups most worth reaching out to, such as recent joins, past-due accounts and members who missed their first payment.
Collections work the same way. Payment trends by location show a manager where recovery effort will pay off. ABC Insights includes a Past Due Analysis dashboard for tracking overdue accounts. Payment decline rate, aging balances and collection performance by location are all available, and the Collections by Age report is the starting point for aging and performance.
Board and investor reporting without manual rebuilds
Board and investor summaries should not require someone to rebuild the numbers by hand. Insights offers pre-built reports, an ad-hoc report builder that runs custom queries on the same datasets, and exports to spreadsheets and business intelligence tools. Leadership can pull the figures a board needs from the same source club managers use.
📝 Read More: Wellness Watch Report: Fitness Industry Data & Retention Trends
FAQs: Fitness club reporting software
What kinds of reports can a fitness club reporting platform generate?
ABC Insights includes prebuilt reports for conversions, member lifetime value, secondary sales, multi-club performance, club utilization, and revenue analysis. Teams can also build custom queries with the ad-hoc report builder, which uses the same datasets as the prebuilt reports.
How is real-time reporting different from the monthly or batch reports clubs used to rely on?
Batch reports show what happened in a past period, usually after the fact. ABC Insights refreshes throughout the day and is always updated through yesterday, so a manager can see yesterday’s revenue, utilization and sales performance without waiting for the next file.
Can reporting software compare performance across multiple gym locations?
Yes, for the multi-club report and for sales performance across locations. Sales reporting spans teams, locations and campaigns, and the Revenue Analysis dashboard shows how much each club contributes to overall revenue.
Does club reporting software track payment and chargeback data, or just member activity?
Yes, for the multi-club report and for sales performance across locations. Sales reporting spans teams, locations and campaigns, and the Revenue Analysis dashboard shows how much each club contributes to overall revenue.
Can I export ABC Insights data to Excel or other BI tools?
Yes. ABC Insights dashboards can be set up as tabular reports and exported to Excel or other business intelligence tools, so teams can work with the data in the tools they already use.
Can I build custom reports in ABC Insights?
Yes. On ABC Ignite, the ad-hoc report builder lets you run custom queries on the same datasets as the prebuilt reports. For larger projects, such as custom dashboards, custom reports or a data warehouse, ABC offers expert help as an add-on.
What is the difference between Insights Analyze and Insights Customize?
Insights Analyze gives you prebuilt dashboards and reports. Insights Customize includes everything in Analyze and adds custom reports and dashboards. Analyze is included with ABC Ignite and is a premium add-on for ABC Glofox, while Customize is a separate add-on with additional costs.
See pricing
Every location sees the same definitions, the same dashboards and the same data, so decisions at HQ and in the clubs start from one picture.
ABC Insights Analyze is included with ABC Ignite. Find the setup that fits your locations: See pricing